CORE principals

CORE principals… I believe that this is what is missing in today’s conversation.
Leftist ideas are terrifying. But many (too many) Democrats cannot or will not see it. In too many minds and conversations, it is just politics. Both sides are the same and just playing games.

But if you keep yours eyes open, you can see through the politics, the noise and stand strong on CORE principals. It is very sad how many people simply do not have any CORE principals any more. Success by any means, power at any cost is deemed acceptable.

This may be why you, me early on, and many others simply did not like Trump. We did not trust his core. He has shown us entertainment focus, self-aggrandizement that made us question his core. However, the events of the 2016 campaign, the transition, his presidency and COVID have exposed his CORE. And his CORE truly is America First.

These same events have exposed the CORE beliefs of many others — and those are terrifying. We are supposed to ignore what these events expose about them and just believe it is politics or that it is only to counter Trump. Everything will be just fine once Bad Orange man is gone. But underneath all the political noise, a CORE set of principals show an anti-American bias.

What the GA models really say…

I decided to follow up on my own post and spend some time with the simulator and charts that are making so much news. https://analytics-tools.shinyapps.io/covid19simulator07/

First, if you see their actual charts you will see a third graph that no one is sharing. Lockdown to a full reopening if even better.

So what do these really say? What are these models. Here are their definitions that you are unlikely to see anywhere.

We simulate model outcomes until August 31, 2020 under different levels and duration of interventions, as defined below:
1: Minimal restrictions: There is no intervention in place to reduce the spread of COVID-19. However, there is an assumed level of learned social awareness (handwashing, avoid close contact when sick, etc.) that is included in the model. Please see the methodology for more details.
2: Current intervention: For most states this is a stay at home order, where people are advised to stay at home except for essential needs such as grocery shopping and picking up prescriptions. The New York Times provides a list of the current interventions in each state.
3: Lockdown: There is a complete ban on travel, including canceling flights and closing inter-state travel and local travel, as has been done in some countries such as Italy, China, and India. Exceptions are made for essential needs such as grocery shopping and picking up prescriptions.

To summarize, the grey (minimal) is a return to a very normal open environment. Current is a bit open since each state is very different on “current”. And then Lockdown is no travel with some open for essentials.

Working with those definitions where are you today? What is re-opening under the three phases? I would argue that most of the country is currently in lockdown and the reopening is not minimal as shown in this graph but a minor nudge beyond stay at home. What is missing the the stages of current of the three phases of opening before we return to minimal.

The third and ignored chart is the most fascinating to me. It seems to say that if you lockdown for four weeks you can reopen widely with little impact. Isn’t that exactly what we just did? I worked a few other models through the simulator that do not have the same hype factor and “GA is blowing the doors wide open”. But I hope they are reality.

These two charts show sticking with current tight lock down for two more weeks, then 4 weeks with “current” restrictions and then wide open (mirroring as best possible phase 1, 2 and 3). Or a second strategy of just sticking with the “current” for 12 more weeks. What these graphs show is that tighter restrictions and a slow opening is slightly better than “current”. However, the basic fact is that if you open too far, too early you can get a spike. Is that news?

But what is shows even more is the uncertainty. Notice that the shaded background says that we “may” have a spike in deaths and cases, but the predictive line line says “or we may not”.

My basic thesis here is that the models still do not reflect reality. “Current” is a wide variety of options across the 50 states and the world. I would argue we lean closer to lock down. However, the overall impact of those definitions does not seem affect the curves greatly. The biggest impact is a return to “minimal”. A metric that no one is advocating in the short term. These models also ignore the economic impact that a lock down and/or current policies have on businesses, people and neighborhoods. Fact is this is a hard problem with a lot of variables. I appreciate the efforts to try and get a handle on it from every front. But this as with every other model is being intentionally misused.

GA reopens and thousands more will die…

Just ask the models, but do not dare ask any questions of the modelers or the input data. Here is a link to the simulator and model that is referenced https://covid19sim.org/

https://www.thedailybeast.com/ending-coronavirus-lockdowns-in-mississippi-georgia-and-florida-could-doom-thousands
undefined

https://www.11alive.com/article/news/health/coronavirus/covid-19-simulator-sees-a-second-wave-of-cases-in-georgia/85-87a01943-e29c-46ac-962e-86642eb5b4ef

Simulators and models show thousands more will die. As I have mentioned, a few things drive me nuts here.

  1. Social distancing “flattens the curve” it does not stop the virus or immediately trend the curve down. See math and even 11 alive themselves last month. So how do they get away with publishing reduced mortality numbers? Why does no one ask? If you compare social distancing to any arbitrary closer date (7/30, 8/30) the numbers can be made to look better. But if you let both curves return to baseline, you end up in relatively the same place. But a spike is panic and a slow trickle of daily death is somehow more accepted. Accepted without question.
    undefined
  2. The other, more dramatic curves never come back down. If we see a dramatic spike, we will also see a dramatic increase in immunity and antibodies and a faster return to normal. Again, focus the chart only in the near term so that it looks like the spike goes on to infinity. Do not show that the spike returns to normal long before the almost flat line of a lock down.
  3. They are never questioned. Never have to justify their predictions and numbers. Just show graphs and numbers and speak to your model. This has much to do with the fact the media folks are severely lacking in any math or science skills. I have dozens of questions and woudl love to talk for hours about the input data, the model, the techniques, assumptions et al…

    But even simple and consistent questions should be asked of all models like… Does your model ignore the current immunity that we are now seeing in reports? Why does your model only show a new spike and ignore the current flattening and infection rates since; now; January? Does your model assume a return to a pre-COVID normal without the phased opening that everyone is talking about? AND the big one from above… If social distancing and lock downs flattens the curve, how does it then prevent death overall it seems you stopped your projections in August? These are not gotcha questions, they are legitimate questions to help the audience understand and any modeler [not out for political points] would have already had to have answered within the model itself.

The good side of this one is that we will know quickly how much we track to the low end, mid line or top of this curve. I appreciate the credentials of the schools involved. But education and study is not reality. These models, students and professors will learn from mistakes here and improve. In the meantime, garbage in; garbage out. And allowing the media to take math use it to panic (versus educate) the community.

7 Things COVID-19 Has Taught Me

I was going to offer a pros and cons list, but upon reaching the first item I found it difficult to simply categorize these items in such black and white terms. This is a time for action, but also a time to understand the unique shades of grey. Which leads directly to item one.

1) We are not so different you and I. Democrats and Republicans, Independent and centrists; we all care about humanity, our country and our families. Media loves to divide us; to magnify the differences. But under the current threat we are willing to put our lives on hold for ourselves and protect others. We are pack animals and differences abound, but we are all part of the human fabric. Prior to this crisis, I have traveled city to city and met with people in various industries. After-hours in most cities politics will some up. But if we listen and we show our humanity, we will learn that most of us simply want to perform in their jobs and leave the world better than we found it. The definition of “better” is our own pursuit of happiness. As long as I am not a threat to yours and vise-versa, we are usually willing to give each other the liberty to act.
Exceptions exist. Some only see one right path, one answer to each question. Many of them are called “journalists” and/or “politicians”. But both of them currently exist and profit from division. A true journalist, documents (i.e. journals) the world around them to share with others. A true politician represents the interests of their community. Not to force that interest on to everyone else, but to make sure that those interests are allowed to run free.
Maybe the recent goodness shown my most Americans will help to elevate these minorities from their divisive natures. Since even a crisis must be exploited, there is little change that it will. But maybe the rest of us will see more clearly who we really are and see them for who they really are.

2) Crisis highlights core principals. From Donald Trump to your local mayors, governors, senators, congressmen and the American People in between, we have seen many differing actions. The media wants to say there is only one proper action; anything that is the opposite of what President Trump says. But the actions taken in and of themselves, teach us something. The left-leaning among us jumped into action. Yes “to help” but also to take control. They will tell everyone what is the only and proper action approved by the government. They will put the power of police and government to make sure that you comply. Look to Detroit for the extreme of that case. The more conservative struggled to take control. They preferred to issue guidance over mandates. Some would argue (and the media has) waiting too long, not going far enough, and then reopening too early. That may be true, but which do we as Americans want going forward? Do we want a government that is quick to act by controlling the population or one that hesitant to take control over our lives and quick to release any emergency powers that that have taken? Undoubtedly, they both have risks.well, provide value and raise themselves and their families.

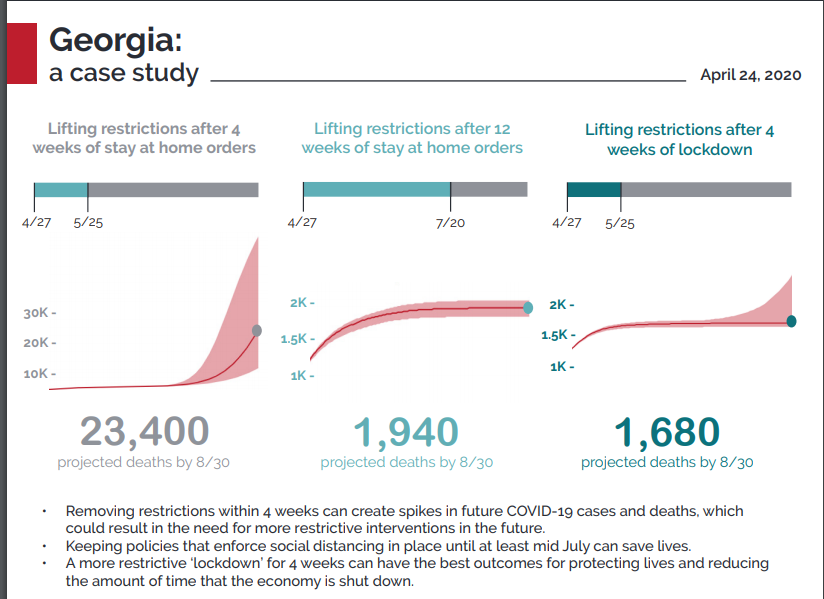
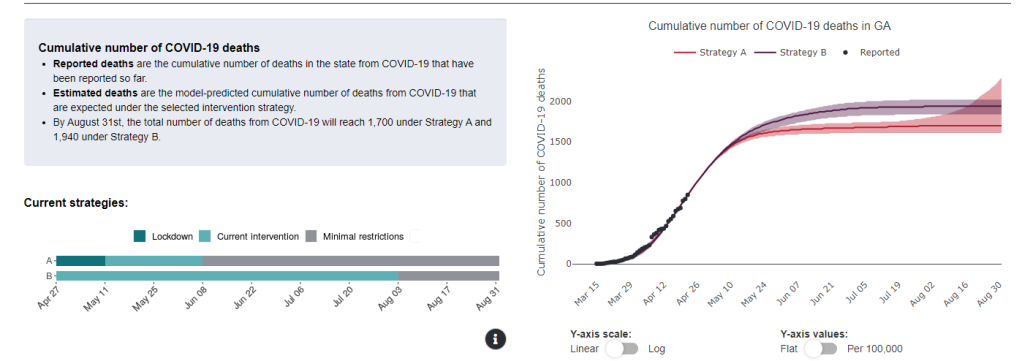
3) Models for healthcare are really bad. I find it hard to believe it is the industry (healthcare for data science). I believe it must be that we are trying to put mathematical models against a reality that is far more random than normal. People are unique. The public models miss even the obvious; age and current health. But add in heredity, socio-economically, cultural variables and we are not even close to predicting outcomes. To get any confidence in the numbers we end up with outrageous large ranges; from 10,000 deaths to 2.5 million in the US alone.
The only way to get to 95% confidence is to expand the ranges: i.e. 10,000 to 2.5 million deaths in the US alone. This one is new and media-hyped (no math skills at all) so I have tried to explain some of that away. However, the annual flu numbers, which we know a lot about have wide ranges as well [i.e 2017 -> 29,000 or 61,000].
To try and summarize it all; I saw this interesting article about Swine Flu studies during my research. 12,197 papers, trimmed down to 422, then further to 120 full length reviews and then down to 50 specifically non-biased studies. And the result is a mortality rate “ranging from less than 1 to more than 10,000 deaths per 100,000 c7) A huge number of people die every year. I was stunned as I looked into numbers of COVID deaths to find that we lose over half a million people every year due to heart disease.ases.”

4) This is a good trial for Socialism and Communism; Green New Deal. We have seen personal rights and responsibilities removed; no air travel, massive reduction in automobile travel; shortages in the supply chains; 20% unemployment; no entertainment industry. Based on historical references, this is what government control of the economy brings. We now need to print money to pay people not to work; limit industries to those deemed “essential” by the central government. Is this not working working for you?

Thomas Sowell says that Economics is the management of the distribution of limited resources. We have differing ways to get products to market and to the most people at the best prices. This current environment does not fit that definition at all. And as such, I would argue this current environment is not an economy at all.

5) A huge number of people die every year. I was stunned as I looked into numbers of COVID deaths to find that we lose over half a million people every year due to heart disease. A similar number to cancer. A larger number of infants to abortions. And so far, still more to the flu. Imagine if we are hit every day with a tracking metric on the 56 million abortions performed worldwide. How would that impact society?

I know this is not “voluntary” and currently we are told it is hard to avoid. That lack of knowledge creates the fear. I am working up tracking line for many causes of death so that we can all understand this in context. Maybe we can all do a better job of not ignoring all the lives we lose every year for any reason?

6) Trump right man for the right time. You do not have to like him or agree with him, but he does act without political consideration. Stopping flights from Wuhan, China before others were willing (but after China already did), sheltering in place and harming the recovery. These were not political calculations, they were the actions taken by a leader to do what he thought was right. It is so odd to see leadership in DC that I thre some people for a loop.

Since then he has pushed for War Powers and Public Private Partnerships versus government running alone. See CDC original tests tainted with COVID as compared to the private sector ramp up in testing, companies retooling assembly lines (who knew you could even do that) and all the research. I do not believe that a government first and/or political calculation would have ever moved these mountains.

The next big move will be to retract these powers. It is in that action that we will really see the difference between leadership and political power. I am hopeful that President Trump is up to the task. He really may be the only one.

7) The environment might not be as fragile as many claim. The environment is a very very complex chemistry experiment that we barely understand. Our actions have consequences but they do not act alone. The planet adjusts, other reactions occur and the system re-balances. Look at the articles about smog lifting and the Himalayas being visible again, Venice and jelly-fish. As much as this is a trial balloon for Communism on a world-wide scale. It also proves that the Green New Deal, 100s of Trillions of dollars and other Draconian actions are likely not needed. If 2 months off can allow these areas of the planet to recover this much, maybe we can work to be a bit better.
I tend to believe “the environment” is not it’s own thing. It is the aggregated result of all of our local actions. Do the right things locally, India, Venice, NYC, Colorado, Main Street and the overall environment will improve; the chemistry will re-balance. Forcing the US to take it on the chin while allowing, China, India and more than half the world’s population to do whatever they like is not the answer; as the aggregate is not impacted. Additionally, polluting locally in Indiana and then paying for trees in Africa; not an answer. Destroying the rain forest to put up wind farms and subsidize solar panels; not an answer. Carbon offsets are a crock; unless you are “offsetting” within the same community that you are polluting. That is called, being a responsible business and that is all we ask.

Revising models due to changing reality or just bad models?

I keep harping on the bad math within the COVID-19 reporting. But I guess it is the world in which we live. I do not blame the Mathematicians. In back offices, they are trying to build models to predict outcomes. The models are only as good as the data they are fed, and the current data is lacking. Those of us in the industry understand that. But we then share that model to our bosses, who then play a game of telephone with the data, then hand a talking point to the media [not known for their math skills] and here we have it.

GARBAGE IN, GARBAGE OUT.

This is a phrase used a lot in the data modeling , data mining industry; it fits these models today. The models are improving, but what does it really mean when the numbers are “revised down”..again and again?

Does it mean that the reality on the ground is improving? Many will make this conclusion. Jumping to: “social distancing is working.” The situation on the ground is, no doubt, helping flatten the curve which helps ensure that our hospitals are not overrun. But they were yet to be overrun, people were not dying in the streets, laying on gurneys like a MASH unit. The fact is that we are using social distancing to stabilize the system. However, social distancing does not (and is not intended to) change the outcomes, it does not stop “everyone” from eventually getting the disease. Note, if it is able to delay us enough to break the disease by seasonality, a vaccine and/or treatment options then we will have fundamentally altered the mortality, but we are not there.

So if “social distancing” is not the answer to dropping mortality… I offer an alternative and math based answer. The GARBAGE IN that we are feeding the model is simply improving. More and more data, more and more cleaned and refined data from a larger population is improving the model(s). Now my pet peeve…the mortality rate is likely NOT CHANGING at all. Only our ability to model the reality of mortality is changing. Put another way, our confidence in the model to predict reality is improving. We do not yet have a reality on which to test this model and prove accuracy. What I have always loved about math and science is that there is a right answer. 2+2 IS 4. I can prove it. Math without reality is simply opinion and conjecture.

Update 4/13: [Bill Bennett – RealClear Politics]
Our officials and media have warned us of 2 million deaths in the United States.  Then 200,000 deaths.  Then 100,000 to 240,000.  This needs to stop. There have been a total of 68,000 coronavirus deaths worldwide. 

MORE Bad Math and progress on COVID-19

This is a followup to the original bad math being used for the modelling of COVID-19. As noted by Dr. Fauci we could not predict with any certainty (or compare to the flu) due to a “denominator problem.” Since then, Dr. Fauci (the same one) has compared COVID-19 to the flu (stating it was 10x worse) and quoting additionally from data models that predict 250k-500k dead in the U.S.

I will give him a modicum of credit, in that, he was trying to move down from the 10% mortality rate and the original models of 2.5 million dead in the United States alone. But in quoting the revision of faulty math based on a new “denominator problem.”, is like revising your business model because you realized most men do not wear women’s clothing. The original model should have been laughed out of the room, and revising it to remove pure lunacy, does not make it right. We (I dare say he) should have avoided using second grade math to replace pre-school finger counting.

The two items that we needed to create an effective model, still do not exist. We have not tested an entire confined population to understand the rate of infection and severity of symptoms. We also have not conducted a anti-body (seroprevalence) test to understand how many people may have already built an immunity to this form of COVID-19. The only right answer is “We do not have enough information to create ANY mortality model that compares with the flu. We will continue to put the full force of government and the American healthcare system against this epidemic to drive towards the most successful outcomes.” As I noted prior, this is half true, based on hospitalization and symptomatic presentation you can compare with those like populations of the flu, but that is “conspiracy theory” and may downplay the response.

I am all for ‘safety first’ and ‘prevention is worth a pound of cure’ but may patience for 100% government control of the economy (is there a word for that…Social Distancing… no that isn’t it…Commun..ity; no not that either). In any case, we are all willing to help our fellow Americans and do our part. But 15 million unemployed, mounting personal debt, unrestricted government spending and zero freedom of movement is not a permanent form of government that works [take note for November].

Closing with some good news, some non-politicians are trying to get us the numbers we need. They are also starting to indicate the cracks in the current models. Stanford is conducting a population test for anti-bodies in Silicon Valley. There are other such test going on in the UK, though they have indicated issues with the test kits. Unfortunately, these tests will likely have to be double tested, cross-checked and documented. But they are moving in the right direction.

Questioning the to the 2-4% mortality rate the researchers stated “If the number of actual infections is much larger than the number of cases – orders of magnitude larger – then the true fatality rate is much lower as well. That’s not only plausible but likely based on what we know so far” For those still working on math at the second grade level, “orders of magnitude” usually means off by a factor of 10, 100, 1000 etc. Which one remaines to be seen. The statement “likely based on what we know so far” is interesting. But unlike the 2-4% model, or the 500K dead revised down to 250K dead, down to 80K dead, down to 60K dead. They are holding on to their results until they have enough data to make a definitive claim. Both frustrating and appreciated.

Math versus Panic… Flu versus Coronavirus

First, let me say. Stay safe, wash your hands and avoid sick people. But I wanted to do some digging on the math, “the denominator problem” as Dr. Fauci stated.

Lots of news organizations want to push the panic button. “ten times worse than the flu” and they jump all over it. But the same denominator problem still exists. I know that we can only deal with the numbers that we have and that news organizations are quick to latch on to anything spectacular to drive audience. So lets look at what we have.

We have a Flu metric that is based on annual projections of the entire us population with years of immunity and antibodies (those would be on our insides). We can therefore project that in a given year 10% of population will come down with the flu, a half a million will visit a hospital and 30,000 or more will die. Nasty; and that gives us the .1-.2% mortality rate.

With this new virus we were originally looking at a 6.8% mortality rate in China…WOAH. But this number was not of the whole population or a projection of 10% of a million people. This was of the original group in China the presented symptoms and were hospitalized. Since this first population, there is now LOTS of news coverage, better hygiene, more tracking and we are now catching the symptoms earlier. The rates in China have now dropped t(reported by China) to .7% in other cities. That new population is still based on those people presenting to healthcare workers or those with symptoms; not a whole population. But that shift from originally very sick to those presenting after the news coverage started is a important change in the selection bias of the population.

So how do we compare these numbers if we do not have the knowledge to estimate COVID-19? We do have flu numbers, years of them. We have the rates of flu for those that present to medical professionals and those hospitalized. Those numbers would seem to better represent an apples to apples comparison to the pattern being observed above.

For the 2018 flu season, there were an estimated 35 million cases. Of those, 490K were hospitalized, accounting for 34,157 deaths. That is a 6.9% mortality rate for those that were hospitalized due to symptoms. Right in line with the initial population of Hubei province. Like Cornavirus, the flu tends to be far worse in the more seasoned population. Within that group the mortality rate after hospitalization is 9.1%.

So lets’ take a step back and move on from the initial outbreak and look at more expansive testing. If we expand the flu numbers to include those that visited a medical professional with flu-like symptoms we expand our universe (for 2018) to 1.7 million people in the US. Same death toll accounts for 2.0% mortality rate. We seem to be trending lower than that as of today.

Though we are between .7% and 1.4% mortality for COVID-19, we still have a denominator problem. We have not yet conducted population-wide studies. Some recent numbers begin to shed some light. 80% presenting with mild symptoms. It looks to me like the initial population of acute symptomatic people was following the universal 80/20 rule. 80/20 = 20% and 20% of 6.8% is 1.4% … right in line with the flu.

What I am looking forward to learning (numbers not people, well wishes on all the people) is two things; the full population test of the Grand Princess and a full antibody screening of populations for exposure. Those will inform us about non-symptomic carriers and the overall contagiousness of the virus.

These new numbers will help us a lot in finding the correct denominator(s). Until then, let’s try to use some prudence and work to compare like populations. We may look back at COVID-19 as just another nasty flu. Better safe then sorry. A pound of prevention. I get it. But we are wreaking havoc over the world’s economies, hurting business, hourly workers and creating a general panic. I get that it is new and unknown, but the news should be helping us make sense of the numbers. Instead they breed the panic, show the empty shelves, and ignore the progress. Yes, we need to remind ourselves, to wash your hands and avoid sick people… with the Flu; that thing is nasty and kills people.

UPDATE 3/20: Does not look like those in charge are going to test everyone on the Grand Princess. We will not be able get the full population numbers that would truly inform the denominators. Mobile testing units and New Rochelle, New York may help inform the metrics.

UPDATE 3/26:
Seems others beginning to say the same; using math versus panic.
In the coronavirus pandemic, we’re making decisions without reliable data [STAT]
FSI – Is the Coronavirus as Deadly as They Say? [Stanford references WSJ]
Is the Coronavirus as Deadly as They Say? – [WSJ]
What do we know about the risk of dying from COVID-19? – [Our World in Data]

UPDATE 3/30:
The mystery of the true coronavirus death rate [Financial Times]
“Arguably the biggest unknown about Covid-19 is the true number of people worldwide who have contracted the virus. Without that information no accurate death rate can be calculated.”

Coronavirus death rate: What are the chances of dying? [BBC News]
“On 17 March, the chief scientific adviser for the UK, Sir Patrick Vallance, estimated there were about 55,000 cases in the UK, when the confirmed case count was just under 2,000. Dividing deaths by 2,000 will give you a much higher death rate than dividing by 55,000.”

Liberals and Math; not close friends

Bloomberg Could Have Given Each American $1 Million With Money He Spent

https://www.realclearpolitics.com/video/2020/03/06/msnbcs_brian_williams_new_york_times_editorial_board_member_mara_gay_five_divided_by_three_equals_one_million.html

Wow.. just … … wow. I get that the person originally posting may have been drinking or just outraged. But Brian Williams, his producer, the editors, the camera man, teleprompter ANY ONE can you do basic math? Millions/Millions… 1 over 1 .. no one?

But the failure of talking heads and their sycophants not being able to do math is barely the point. But this elevates two very telling points. First, is that these people do not vet anything. Any excuse to attack someone they disagree with is fair game. Facts, verification and truth play no part. The second part is even more important.

The party of the left has no basic economic understanding of scale. This math was off by a factor of 1 Million. Not a factor of 2 or 3, even 10… a million. No business man, accountant, or their assistants have ever come close. So they can talk about a 70 Trillion dollar plan that will be covered by a “tax on the rich”. Elizabeth Warren can state that funding 40 Trillion dollars with a .02 cent tax on Billionaires and no one the left even blinks… the math is not even close.

Some time for some basic math… Bloomberg is a Billionaire; there are about 550 others like him with a total net worth of 2.5 Trillion dollars. 2.5 is less then 40, which is less than 70 (removing the zeros so as not to confuse MSNBC). Let us assume that the plan from these politicians are 10 years numbers (as most are). Even if you took every dollar from every billionaire (all of it, not .02 cents). You could not fund the first half of the first year of these plans. And then month 7 arrives, month 8, year 2, year 3 and you have NOTHING left to confiscate. The program is bankrupt. For the .02 cents Warren says you would need, you get far less than .2% (.00125) of the revenue you need (and that is on the cheap side)… only off by a factor of 500X.

But worse…this “Net worth” is not in cash. This is not annual income. It is a lifetime of work and it is in their companies; stock valuations. So you would have to sell off their entire private portion of their businesses. Sell it off to pay the federal government. Likely in violation of most of their employment contracts and public trading laws. So we collapse Amazon, Facebook, Bloomberg News, Apple, Trump International.. etc.etc… 500+ times to get 6 months of Socialism. Clueless or just dishonest?

So let us expand to all those “rich people.” Some basic math again for Mr Sanders plan… 70 Trillion over 10 years is “about” 7 trillion a year. Based on the most recent tax numbers released (2016) we would need to DOUBLE the tax burden of the top 25% of all tax payers (or 35 million households).

If that cuts too deep we can keep it to the top 5% [those 7 million rich folks]. 70 Trillion/7 million… 12 zeros/6 zeros.. Lots of carrying zeros here Brian… EQUALS 10 million dollars of new taxes.. 1 million a year in new taxes on each and every one of these families.

You see, the full tax burden of 100% (that means all) of the tax payers in this country is 10 Trillion annually. That is absolutely everything. So to increase spending for just one of these plans we are talking about massive tax increases on working families and the middle class. There is just not enough money in these deep pockets of a small number of “rich people” to ever cover these plans. But I think that is the point.. it is not about the price of the plan it is about a massive tax burden, a massive federal government and class envy. The numbers never need to work… right Brian?

Update 3/16:
Alternate option… they do so little work in media and people like Brian Williams make millions. So anyone can make millions. Anyone not making that kind of money on little talent and nice hair must be oppressed by the system. Cause the system is stupid easy.

Trump CAN win California in 2020

Rush Limbaugh said that Trump should campaign in CA. Not because he can win it outright but to set the stage.  He is correct; but also wrong (sorry 98.6%).

Trump can win CA easily and campaigning there is obviously and important step.  CA passed a law that all 55 of their electoral votes go to the national percentage winner of the popular vote (https://www.nationalpopularvote.com/state-status). Trump no longer needs to win CA outright.  He just needs to shift  enough votes combined with other national votes to win the popular vote.

Many Republican voters were unsure how a President Trump would lead, some even voting for Hillary. Trump now has a history of policy and action. His rallies are bringing people of the sidelines and Democrats across party lines. With this economy and left wingnuts against him, the 3 million vote difference (1-2%) seems in reach.   Making that small shift by campaigning in NY and CA and those two states [ CO, VA, NJ, IL are yours]. 

A 2% nationwide shift and it is an electoral landslide for Trump in 2020.   Thank you, factions and passions for trying to force a democracy on our representative republic. First the 17th amendment and now this. Our Constitutional structure had many protections against this kind of faction driving public policy. This is exactly what states rights, electors and our founding opposition to “faction” was supposed to protect against.

“A Republic, if you can keep it.” – Ben Franklin 1787

Healthcare still the major weakness of Trump Administration

The GOP and President are failing on Healthcare as they did in 2018. If the GOP can take this issue from the left, they will have kicked the last leg from the Democrat stool.

You cannot just talk big picture, protect preexisting conditions, cheaper etc. You need a plan. The left has plans. We may not like them but just opposing a bad plan is not leading. Facts matter; the rest is opinion about what a plan could be BUT IS NOT.

So here is my simple argument for a universal HSA plan. You may think people already know about HSAs but most do not.

The left wants control over your healthcare. Whether it was Obamacare, medicare-for-all or somewhere in between, the destruction of private healthcare is the goal. [Obamacare was meant to fail to pave the way for single payer] We have another goal. Individual rights and personal choice.

Our plan will open up Health Savings Accounts for everyone. HSAs, backed by private insurance, protect individuals from catastrophic healthcare costs and put buying power and decisions back in the hands of you and your doctor.

It is “insurance”; a healthcare safety net and not a welfare handout. We will allow more widespread funding of this personal protection. Whether it be your employer, your family, your church, charity or the state and federal govt; we want EVERYONE to have the security that if something bad were to happen you will have coverage.

The HSA nest-egg is 100% transferable between jobs, insurers and in the rare case (during GOP administrations) unemployment. Healthy and young people benefit most by building this protection before it is needed. With a large healthcare protection fund behind you, you will be free to shop healthcare and insurance prices, switch doctors, pursue a new job. We will bring competition back to the healthcare market.

Employers will continue to compete with added benefits and increased funding, but your basic healthcare needs will be yours and you will be protected.